
Which states are hit hardest by Canada's 50% tariffs?
- Authority
- Government of Canada
- Rule type
- regulation
- Jurisdiction scope
- Canada federal
- Effective date
- Sep 8, 2026
- Source text
- Read primary rule text ↗
Match each Canadian-bound shipment to Canada's August 26 HS-code list and apply the specified 15%, 25%, or 50% rate for covered entries on or after September 8, 2026.
The states hit hardest by Canada’s 50% tariffs cannot be identified by simply ranking their exports to Canada. Canada’s counter-tariffs, effective September 8, 2026, apply at rates of 15%, 25%, or 50% to a defined list of products identified by Harmonized System codes. The list was updated August 26 and covers approximately $27.6 billion in U.S. goods, according to the Canadian government.[1]
The 50% rate reaches products including milk and cream, whey, honey, steel and aluminum products, plywood, smartphones, video game consoles, and fishing rods. Most cheeses, household refrigerators, fish, and crustaceans are among the products subject to a 25% rate.[1] Because coverage is product-specific, a state may export billions of dollars to Canada while only a portion of that trade falls within the listed codes.
That distinction matters when reading state figures. The widely quoted numbers for Ohio, Pennsylvania, Wisconsin, California, and Maine generally measure each state’s total 2025 goods exports to Canada. They are useful indicators of the size of the trading relationship, but they are not estimates of the value subject to the new duties.
There is also a discrepancy in the national coverage estimate. U.S.-side analyses have described the Canadian action as covering roughly $20 billion in goods, while Canada’s official materials put the figure at $27.6 billion.[1][2] The Canadian figure is the appropriate scope anchor because Canada administers the tariff list. The lower estimate should not be averaged into it or silently substituted for it.
A state comparison—and what its numbers actually measure
The available evidence points toward concentrated exposure in Midwest manufacturing states, California, and coastal states with substantial seafood trade. But the measures in the following table are not uniform. Most are total exports to Canada; the seafood entries and product categories are narrower clues to possible tariff overlap.
| State | Reported Canadian-bound trade | Relevant product mix | How to read the figure |
|---|---|---|---|
| Ohio | About $17.5 billion in total 2025 goods exports | Engines and turbines, vehicle parts, plastics, automobiles, iron and steel alloys | Large manufacturing exposure, but the total is not a tariffed-goods value.[3] |
| Pennsylvania | About $13.9 billion in total 2025 goods exports | Manufacturing and industrial trade | A large relationship requiring product-code matching before direct exposure can be ranked. |
| Wisconsin | $7.5 billion in total 2025 goods exports | Plastics, paper, electric motors, beverages and alcohol, machinery, forest products | Several categories overlap conceptually with the tariff list, but broad category totals include covered and uncovered codes.[4] |
| California | About $17 billion in total 2025 goods exports | Machinery and equipment; agriculture | A major potential exposure base whose tariffed share cannot be derived from the state total.[5] |
| Maine | $1.3 billion in total 2025 goods exports | Fish and crustaceans: $299 million | Seafood provides a clearer product-level connection to the 25% list, although the entire state total is not covered.[6] |
| Florida | Total not used here | Approximately $154 million annually in fish and crustacean exports to Canada | A relevant product line rather than a measure of all Florida trade subject to tariffs.[7][8] |
This comparison provides an orientation, not a final ranking. A ranking based only on total exports would favor the largest trading relationships. A ranking of direct tariff exposure requires the value of each state’s Canadian-bound shipments to be matched to the Canadian tariff schedule at the applicable HS-code level.
Ohio shows why the classification work changes the answer
Ohio is an obvious candidate for serious exposure, but not because every dollar of its approximately $17.5 billion in exports to Canada is tariffed. Its product mix brings several substantial export lines close to the center of Canada’s response.
Ohio exported approximately $2.7 billion in engines and turbines, $1.8 billion in motor-vehicle parts, $1 billion in plastics, $913 million in automobiles, and $692 million in iron and steel alloys to Canada in 2025.[3] These figures reveal where counsel and export managers should begin reviewing transactions. They do not establish that every product within those broad categories appears on Canada’s list.
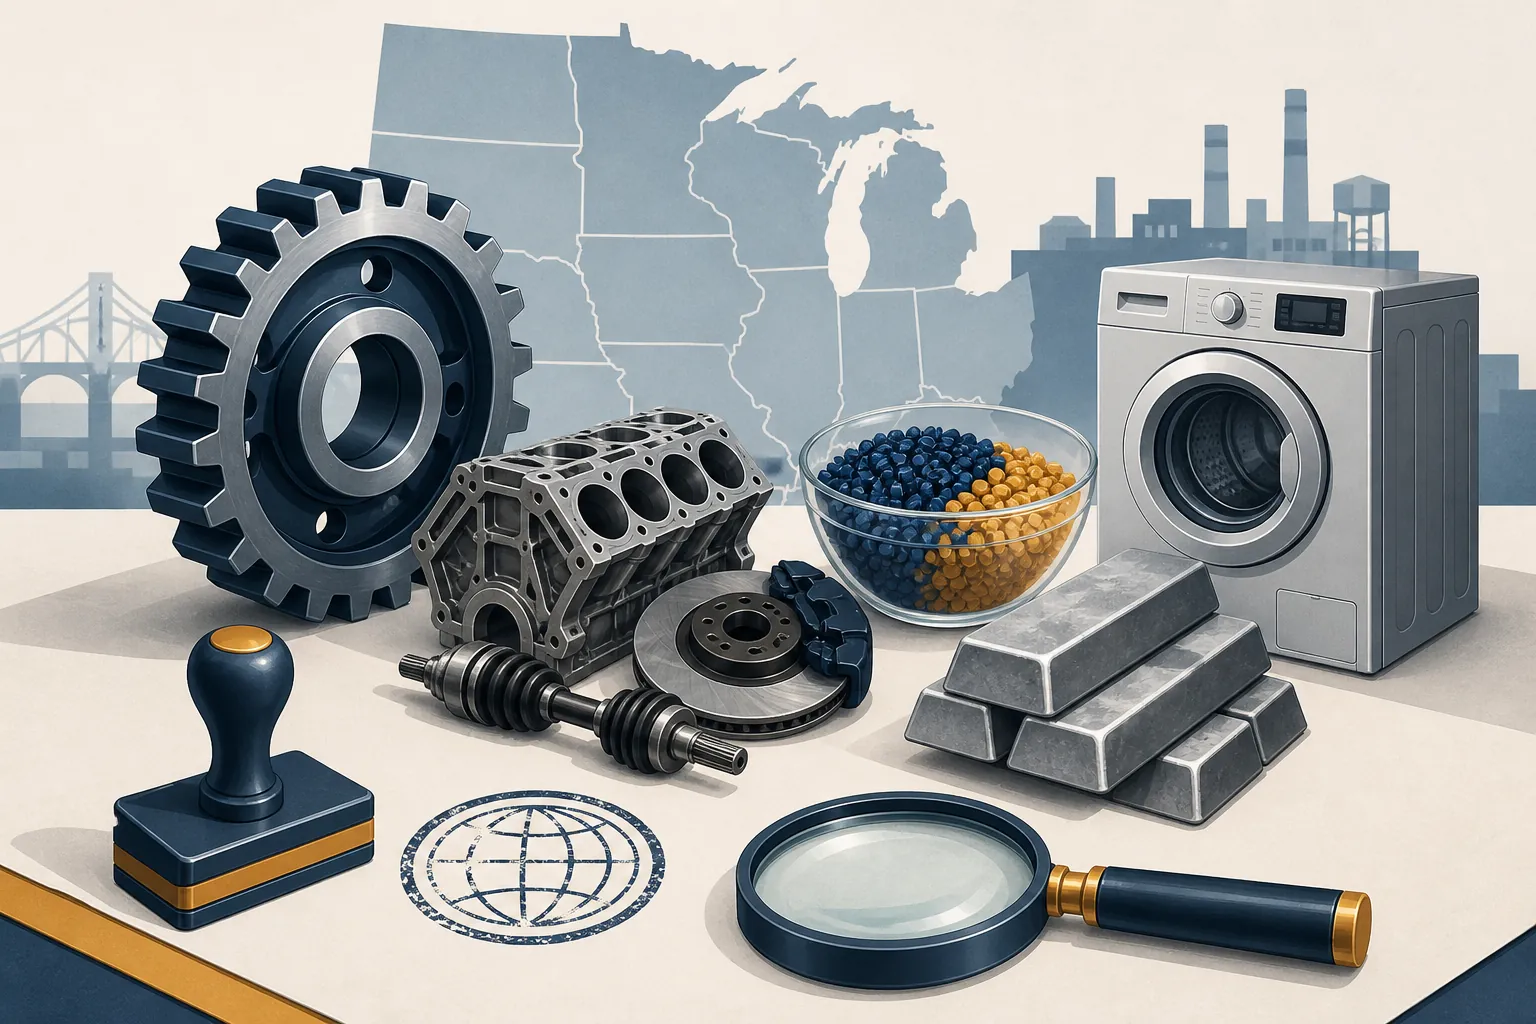
Consider the difference between a category description and a customs classification. “Motor-vehicle parts” can encompass products assigned to multiple tariff provisions. One listed component may attract a counter-tariff while another component sold by the same Ohio supplier does not. Iron and steel trade presents the same problem: the 50% rate for listed steel and aluminum products makes the category highly relevant, but a state-level total for iron and steel alloys is still broader than the operative tariff lines.
The practical review therefore begins below the state and industry level. An exporter needs the classification used for the Canadian import entry, the product description associated with that code, the country-of-origin treatment, the value of affected shipments, and the commercial terms that determine who bears the duty. A map can identify Ohio as a priority. It cannot answer whether a particular engine assembly or plastic component is covered.
Wisconsin presents a different manufacturing mix
Wisconsin’s $7.5 billion in 2025 goods exports to Canada is smaller than Ohio’s total, but its mix gives the tariff review several distinct starting points. Plastics accounted for approximately $566 million, paper for $523 million, electric motors for $423 million, and beverages and alcohol for $231 million. Machinery represented about 35% of the state’s exports to Canada, while forest products represented approximately 11%.[4]
Those shares make Wisconsin a credible high-exposure state without converting $7.5 billion into a claim of direct tariff coverage. Plywood is on the 50% list, for example, but “forest products” is a much broader statistical category. Paper and plastics likewise contain numerous distinct goods. Electric motors and other machinery need to be checked against the listed provisions rather than treated as a single tariff class.
Wisconsin also illustrates why rate headlines can obscure the commercial issue. The relevant question for a paper producer, machinery manufacturer, or beverage company is not whether Canada announced tariffs “as high as 50%.” It is whether the Canadian importer’s code appears on the list and, if it does, whether the assigned rate is 15%, 25%, or 50%. The answer may differ across product lines made at the same facility.
California’s scale does not eliminate the need for product matching
California exported approximately $17 billion in goods to Canada in 2025. Machinery and equipment accounted for roughly 39% of that trade, and agriculture for about 26%.[5] The scale places California alongside the major Midwest exporters as a priority for analysis, but neither percentage is a tariff calculation.
Agriculture is particularly easy to overstate. Canada’s schedule includes 50% rates for milk and cream, whey, and honey, as well as a 25% rate for most listed cheeses.[1] That establishes meaningful overlap with agricultural production. It does not establish that 26% of California’s exports—or all agricultural exports within that share—will incur a counter-tariff. Produce, processed foods, dairy products, and other agricultural goods may occupy different HS chapters and receive different treatment.
The machinery share raises a parallel issue. Smartphones and video game consoles appear on the 50% list, while household refrigerators are listed at 25%.[1] Those examples demonstrate that high-value consumer and industrial goods are within scope, but a broad machinery-and-equipment total cannot reveal how much California trade consists of the specified products.
Seafood gives Maine and Florida a clearer product test
Maine’s total goods exports to Canada were approximately $1.3 billion in 2025—far below those of Ohio or California—but fish and crustaceans were its largest export category at $299 million.[6] Because fish and crustaceans appear on Canada’s 25% list, Maine has a more visible product-level connection to the counter-tariffs than its total-export ranking alone would suggest.[1][7]
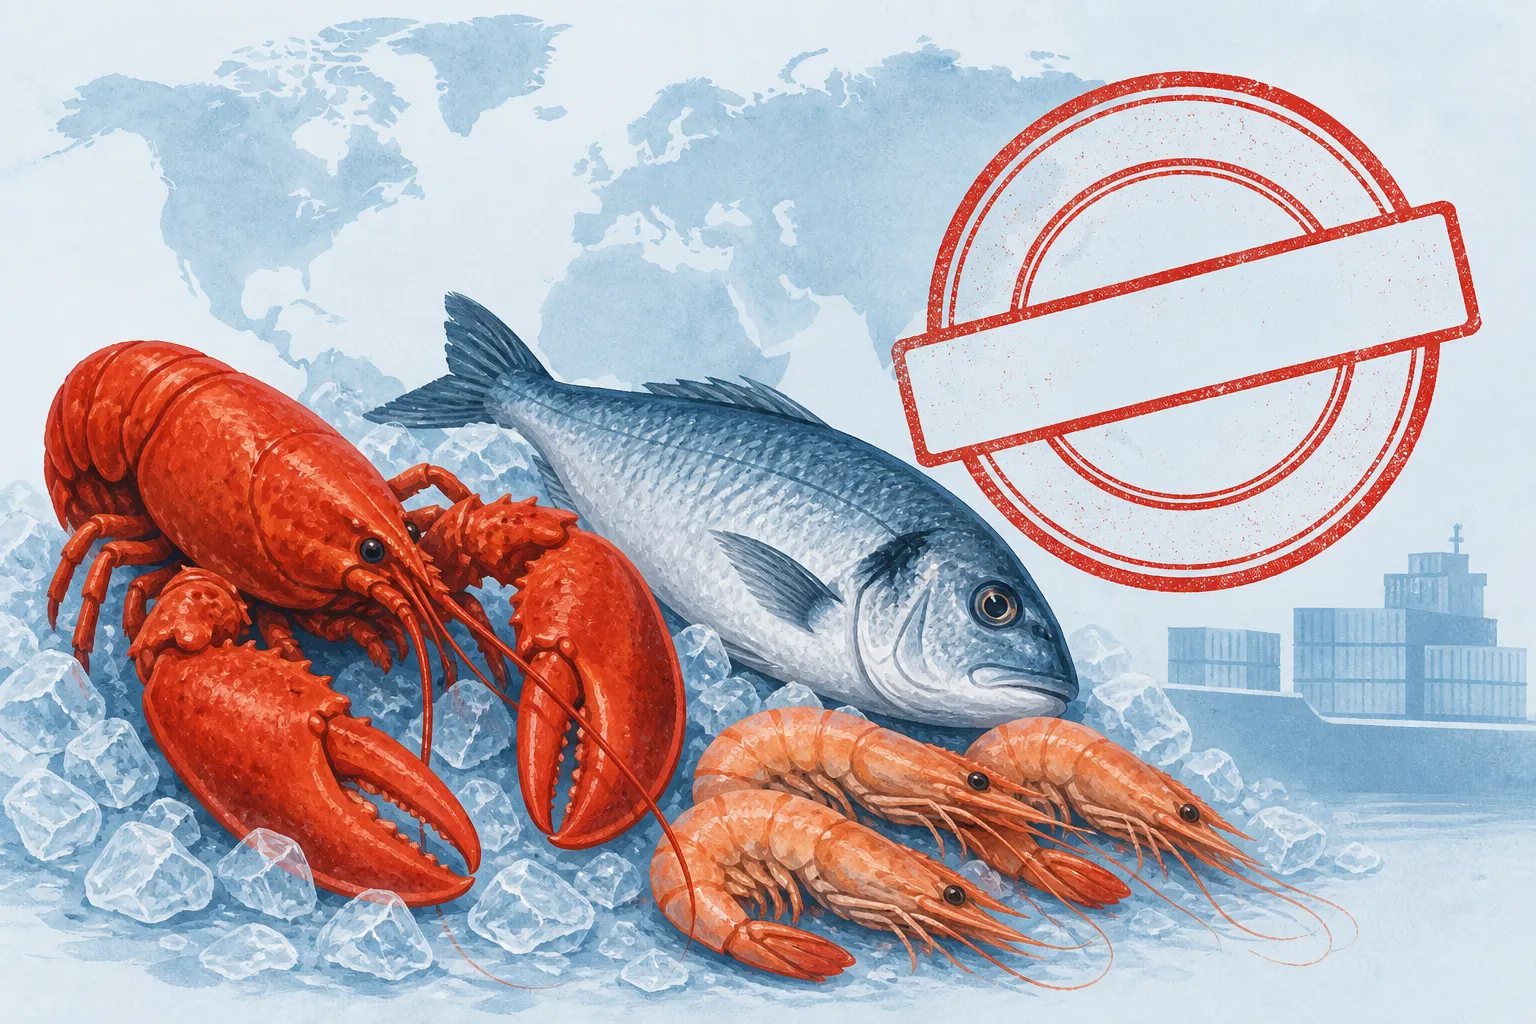
Florida presents a similar, narrower signal. Its annual fish and crustacean exports to Canada are reported at approximately $154 million.[8] That figure is relevant because it describes a product category connected to the tariff list; it should not be presented as either Florida’s total exposure or a finding that every shipment within the category is covered.
Even here, the customs schedule remains decisive. “Seafood” is a useful commercial label, but tariff administration operates through individual codes and descriptions. Species, product form, processing, and classification can separate an included entry from an excluded one. Maine and Florida therefore offer stronger evidence of overlap, not permission to apply 25% to the entire reported category without further review.
Why Pennsylvania and other politically prominent states resist a clean ranking
Pennsylvania’s approximately $13.9 billion in total exports to Canada puts it among the states with a large commercial relationship. That is enough to justify immediate screening by manufacturers and importers, particularly where steel, aluminum, machinery, forest products, appliances, or listed consumer goods are involved. The available materials, however, do not provide the same detailed product breakdown used above for Ohio and Wisconsin. Calling Pennsylvania definitively more or less affected would go beyond the evidence.
Michigan, Iowa, and Alaska have also featured in the political description of Canada’s response. Political targeting can explain why officials selected products associated with particular regions, but it is not a substitute for measuring the value of covered shipments. A state can be politically salient while ranking lower in tariffed value, just as a less-discussed state can have a concentrated industry exposed to a high rate.
The retaliation timeline and its political purpose
The current sequence began with the United States’ Section 338 tariffs of 50% on Canadian goods, which took effect August 22, 2026, after a brief suspension. Canada’s counter-tariffs are scheduled to begin September 8.[2][9] Earlier announced dates shifted, so businesses should use the operative notices rather than older summaries.
Canadian officials have described the response as an effort to apply political pressure ahead of the November midterm elections, identifying states with strong trade ties or political relevance, including Maine, Ohio, Michigan, Alaska, and Iowa. Maine Senator Susan Collins publicly called the U.S. tariffs “a mistake.”[7] Her criticism documents the political pressure Canada sought to create; it does not measure Maine’s resulting economic loss.
The broader trade relationship explains why such pressure may attract attention. Canada was the leading customer for 26 states based on 2025 data, exports to Canada supported an estimated 1.4 million U.S. jobs, and two-way trade was approximately $3.5 billion per day.[10] These figures measure the importance of the relationship, not the reach or effectiveness of the counter-tariffs.
A higher count of 36 states has also circulated for Canada’s status as the leading export market, but the underlying Progressive Policy Institute page was not readable in the available research record. The documented 26-state count is therefore the safer figure. Neither count identifies which goods appear on the September 8 list.
How to determine actual exposure
A defensible exposure assessment needs to be built from shipment or product data rather than from the state totals in a trade fact sheet. For each Canadian-bound line, the reviewer should compare the classification used at entry with Canada’s August 26 list and record the applicable rate and effective date.
- Confirm the Canadian import classification at the full level of detail used in the tariff notice; do not rely only on an industry label or a shortened HS heading.
- Separate covered products from other exports sold to the same Canadian customer.
- Assign the listed 15%, 25%, or 50% rate rather than assuming the headline 50% rate applies.
- Identify shipments entered on or after September 8, subject to any transition terms stated in the Canadian measure.
- Review contracts and Incoterms to determine whether the Canadian importer, U.S. seller, or another party bears the immediate cost.
- Keep total exports, potentially covered exports, confirmed covered exports, and estimated duty amounts as separate fields.
That last separation prevents the most common reporting error. Ohio’s $17.5 billion, for example, belongs in a column labeled total goods exports to Canada. It should not be placed in a column labeled tariff exposure. The same caution applies to California’s $17 billion, Pennsylvania’s $13.9 billion, Wisconsin’s $7.5 billion, and Maine’s $1.3 billion.
Related disputes over U.S. tariff authority can be followed through the site’s tariff-litigation status tracker, its record of states suing over tariffs, and the earlier Section 301 tariff challenge. Those proceedings provide legal context but do not establish that a challenge to the current Section 338 action has been filed.
On the evidence available as of August 28, Midwest manufacturing states—especially Ohio and Wisconsin—California, and seafood-exporting states such as Maine and Florida appear to have the strongest product-level exposure. A trustworthy ranking of which states are hit hardest still requires matching their Canadian-bound export lines to Canada’s authoritative HS-code list. Without that work, a state map ranks trading relationships, not tariff liability.
References
- List of products from the United States subject to counter-tariffs effective September 8, 2026 — Government of Canada, updated August 26, 2026
- Wiley analysis of the Section 338 tariffs and Canadian countermeasures — Wiley
- Ohio fact sheet — Embassy of Canada to the United States
- Wisconsin fact sheet — Embassy of Canada to the United States
- California fact sheet — Embassy of Canada to the United States
- Maine fact sheet — Embassy of Canada to the United States
- Coverage of Canada’s counter-tariffs and political targeting — KCRA
- Analysis of products covered by Canada’s counter-tariffs — Avalara
- Timeline of U.S. Section 338 tariffs and Canadian countermeasures — Blakes
- Canada-U.S. Trade Tracker — Business Data Lab
Operationalizing workflow
No workflow has been explicitly linked to this obligation yet. See Workflows generally.
Illustrative cases
No illustrative case is currently tracked for this obligation. See Risk Digest for documented incidents generally.
← Back to RegulationReport a correction or tip
Spotted an outdated figure, a misstated fact, or a ruling this regulation entry should reflect? Public comments are disabled for this content given the professional cost of a misreported case outcome, penalty amount, or rule text — use the structured correction channel instead.
Report a correction or tip for this record →