
The dangerous sentence in a wildfire claim file is rarely dramatic. It is usually something tidy: “Fire was 60% contained, so the immediate threat had substantially passed.” Or, in a complaint: “Containment remained low for days, showing unreasonable suppression.” The number looks official enough to carry weight and simple enough to borrow. That is the problem.
For lawyers asking about wildfire containment percent legal significance, the first answer is unsatisfying but necessary: a containment percentage is not a safety score, not a measure of how much fire has been extinguished, and not a clean proxy for how much danger remains. It is an operational estimate tied to control line around the fire perimeter. RedZone describes containment as the portion of a wildfire’s perimeter that has a control line firefighters believe will prevent the fire from spreading beyond it.[1] WFCA states the same point through the National Wildfire Coordinating Group framing: a fire is “contained” when a control line has been completed around the fire and officials have confidence the fire will not cross that line, while also noting that this judgment can change as conditions change.[2]
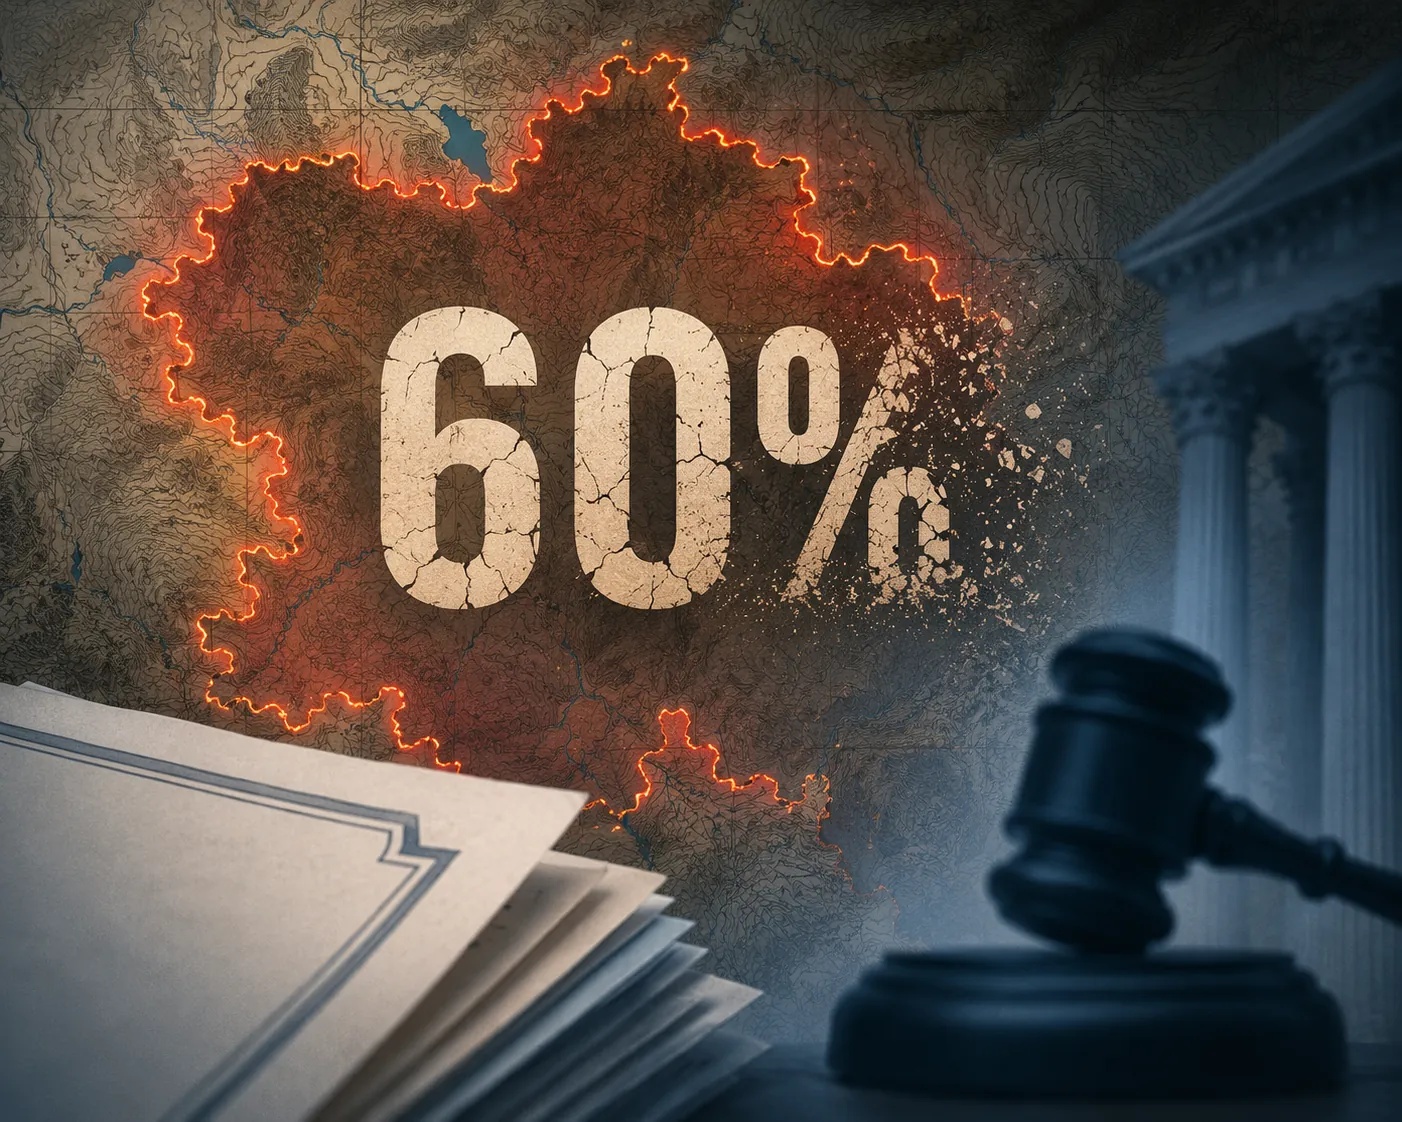
That definition should slow down any legal inference built on the number. A 60% containment figure does not mean 60% of structures are safe, 60% of the flames are out, 60% of suppression work is complete, or 60% of a policyholder’s displacement has ended. It means officials are estimating that control line meeting the relevant confidence threshold exists along that share of the perimeter. The fire may still burn actively inside that perimeter. Embers may still move. Weather may still matter. The uncontained segment may be the segment that matters most to the insured, the utility, the county, or the plaintiff.
What the percentage is measuring
Containment begins with line, not flame. Fire crews and incident managers assess where natural or constructed barriers exist around a wildfire’s perimeter. A barrier may be a handline, dozer line, road, ridge, river, previously burned area, or other feature that can function as a control line. The reported percentage expresses how much of the perimeter is judged to have that kind of line in place and reasonably expected to hold.[1][2]
The distinction between contained, controlled, and extinguished is not lawyerly hair-splitting. RedZone separates the terms: a contained fire has a perimeter control line expected to prevent spread; a controlled fire has line around the fire and no expected further spread; an extinguished fire is out, with no remaining heat or flame.[1] A claim note or expert report that treats “contained” as if it means “controlled” has already shifted the fact being measured.
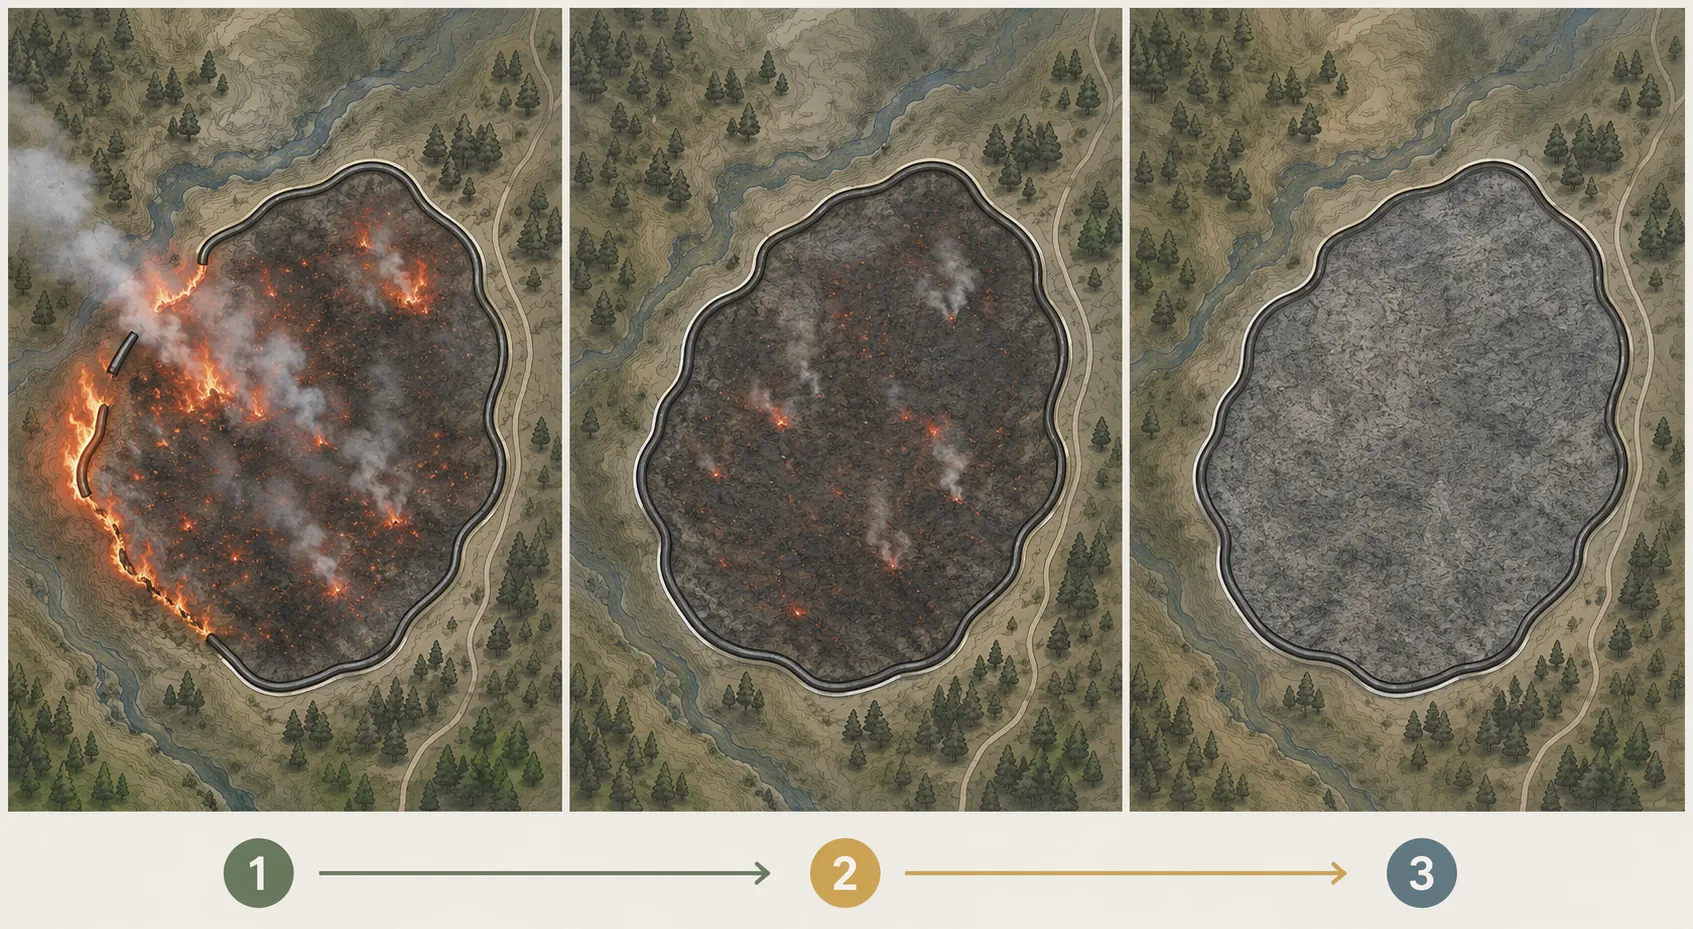
The difference matters because legal readers often want the percentage to answer a different question from the one incident personnel were trying to answer. An incident update may be communicating progress in building and validating perimeter control. A coverage lawyer may read the same update as evidence that civil authority danger has ended. A negligence lawyer may read it as a daily scorecard of suppression competence. A regulator may read it as a signal about public re-entry. Those are not identical questions.
| Question being asked | What containment can help show | What containment does not show by itself |
|---|---|---|
| Has a control line been completed around part of the fire? | Yes, that is the core operational use of the percentage. | Whether the fire is out. |
| Is a particular neighborhood safe to re-enter? | Only indirectly, and only with location, weather, access, smoke, and utility conditions. | A general safety clearance. |
| Did firefighters act reasonably? | Possibly one data point in a larger timeline. | A standalone negligence measure. |
| Should additional living expense benefits stop? | Possibly relevant to the threat environment if tied to the insured location and order language. | An automatic benefit cutoff. |
Why the number can stall, drop, or lag
A containment percentage can frustrate legal chronology because it does not move like a damages chart. It can remain flat while crews do difficult work that has not yet produced line meeting the reporting threshold. It can increase without meaning the fire has become harmless. It can decrease when wind, spotfires, or changed perimeter assessments undermine earlier assumptions about where the fire is likely to hold.[1]
The Soberanes Fire example makes the point concrete. RedZone describes the 2016 Soberanes Fire in California as requiring 374 miles of fire line over 12 weeks, despite much of the fire burning in lower-population terrain.[1] That example is useful because it strips away an easy public assumption: if fewer homes are immediately exposed, containment should move quickly. Perimeter work does not obey that assumption. Terrain, access, fuel, weather, and the size and shape of the perimeter can make control-line completion a huge project even when the fire is not presenting the same kind of structure-defense emergency across every edge.
There is also a reporting problem that belongs in the record before anyone overreads a public update. West Buncombe Fire Department, writing from a local operational perspective rather than as an official NWCG source, explains that public containment percentages can lag behind field conditions because information moves from crews to command and then into public communications; smaller or local incidents may also lack a dedicated public information officer.[3] That does not make the data useless. It makes timing a fact issue.
For litigation purposes, “when was the fire 60% contained?” may be less precise than it looks. The better questions are: when was the field assessment made, when was it approved for release, what part of the perimeter did it describe, what conditions changed after the estimate, and did the legal decision rely on the public timestamp or the underlying operational information?
The insurance coverage shortcut
Additional living expense disputes are where the misuse can become especially mechanical. A carrier looking for an administrable endpoint may be tempted to treat a containment update as the moment “danger” ended, particularly where a policyholder has evacuated, a civil authority order has shifted, or a home remains inaccessible for reasons that are no longer visibly tied to flame.
Containment may be relevant to that analysis, but only if it is tied to the actual coverage language and the insured location. The uncontained 40% of a fire perimeter may be miles away from the property, or it may be the drainage behind the subdivision. A 90% contained fire may still have smoke, damaged access, utility interruption, law-enforcement closure, or interior hot spots affecting habitability. A lower containment figure may coexist with reduced threat to a specific address if the uncontained perimeter is moving elsewhere.
The claims-file weakness is not citing containment. It is citing containment as though the metric answers the policy question without more work. If a denial or benefit cutoff rests on the percentage, the file should be able to show what the percentage measured, what map or perimeter it corresponded to, whether the insured location sat near the uncontained edge, what civil authority orders said, and whether conditions affecting use of the property were fire-caused even after perimeter progress improved.
That kind of record discipline matters for both sides. Policyholders should not have to disprove a false equation between containment and safety. Insurers should not be barred from using operational data simply because the data is technical. The question is evidentiary fit: whether the containment figure is being used for what it can fairly show.
Slow containment is not automatically negligent suppression
Plaintiffs and subrogating insurers can make the opposite mistake. A timeline showing low containment for several days may look like a clean way to argue that a utility, contractor, landowner, or agency failed to prevent spread. Sometimes the timeline may matter. It can help locate decision points, resource delays, perimeter growth, communication failures, or the period in which damage occurred. But “slow containment” is not itself a standard of care.
Containment depends on the perimeter that exists, the line that can be built, and the confidence that line will hold. The percentage may rise slowly because the fire is complex, remote, wind-driven, difficult to access, or expanding through spotfires. RedZone’s explanation that containment can decrease after wind events and spotfires is important here because it undercuts a straight-line assumption that a competent response should produce a steadily increasing number.[1]
In utility negligence litigation, the more useful inquiry is not whether containment was low in isolation, but what the defendant allegedly did or failed to do before ignition, during the response, or after learning of dangerous conditions. Containment data may help frame causation and damages timing, but it cannot substitute for evidence about equipment, vegetation management, weather forecasts, de-energization decisions, communications with agencies, access constraints, or expert fire-behavior analysis.
The same caution applies to experts. A containment chart can be a useful exhibit if it is anchored to perimeter maps and operational testimony. It becomes vulnerable when it is asked to carry an opinion about reasonableness without explaining what fire personnel meant by the percentage on the relevant day.
Re-entry and evacuation decisions need more than a perimeter fraction
Containment also appears in disputes over evacuation orders, re-entry timing, and business interruption. It is easy to see why. Public officials need communicable metrics, and residents need some way to understand progress. But the legal significance of a re-entry decision usually depends on more than the incident’s percentage.
Road integrity, smoke, downed power lines, damaged water systems, slope instability, law-enforcement access, and the location of uncontained perimeter segments may matter more to a particular community than the overall containment figure. A county that delays re-entry after substantial containment may be responding to hazards that the percentage does not measure. A premature reopening may likewise be hard to defend if the official record shows unresolved threats near the affected area, even where the public percentage looked reassuring.
Here, the lag issue becomes practical rather than academic. If a public update trails field conditions, a lawyer needs to know which information the decisionmaker had when the evacuation, access, or reopening decision was made. The public dashboard may not be the decision record.
Classification problems sit underneath the percentage
Even if everyone uses “containment” correctly, the underlying wildfire data can still create legal trouble. Danko Meredith’s law-firm explainer discusses the Tanques Fire, where the Forest Service classified a management burn as a “wildfire,” a classification the firm says expanded reported acreage by up to 538 times and potentially distorted containment reporting.[4] The example matters less as a universal rule than as a warning: the legal system often receives wildfire data after classification choices have already shaped what the data appears to describe.
The Revelator, writing from an advocacy and environmental journalism perspective, has likewise criticized wildfire data systems and Forest Service classification practices, arguing that flaws in wildfire data can affect public understanding and policy decisions.[5] That critique should not be treated as a judicial finding or as proof that any particular incident report is unreliable. It does, however, support a modest and important litigation point: official-looking wildfire numbers may still require foundation.
For inverse condemnation and large-loss causation disputes, foundation questions can become expensive. If damages analysis turns on when a fire was contained, how acreage was classified, or whether a burn was treated as a wildfire for reporting purposes, counsel should expect discovery to move beneath the public incident summary. Who classified the event? Did the classification change? Did reported acreage include management-burn acreage, wildfire spread, or both? Did the containment percentage correspond to the same perimeter being used in the damages model?
No published appellate rule in the materials reviewed makes wildfire containment percentages categorically reliable or categorically unreliable evidence. That is the wrong binary anyway. The developing risk is more ordinary: a lawyer, adjuster, expert, or in-house reviewer treats a technical incident metric as if it were generated to answer a legal question.
How to read the number before using it
The sounder professional habit is to make the containment percentage prove only what it was built to prove unless other evidence connects it to the legal issue. In a claims review, that means resisting the neat cutoff date unless the map, order, property condition, and policy language support it. In negligence litigation, it means refusing to let a low percentage do the work of a standard-of-care opinion. In re-entry disputes, it means separating public communication from the operational basis for the decision. In inverse condemnation, it means asking whether the incident data and perimeter classification match the causation theory.
- Identify the source of the percentage: incident command update, agency dashboard, local department release, expert reconstruction, or secondary summary.
- Tie the percentage to a perimeter map, not just a date.
- Ask whether the uncontained segment was near the property, infrastructure, access route, or community at issue.
- Check whether later weather, spotfires, or revised assessments changed the containment estimate.
- Distinguish contained, controlled, and extinguished in any witness preparation or expert report.
- Separate what the public update said from what the decisionmaker knew at the time.
There is nothing inherently suspect about containment data. It is often one of the few contemporaneous measures available in a fast-moving fire record. Its usefulness is exactly why it is dangerous when stripped from context. In Q3 2026 legal practice, the exposure is not that lawyers cite containment percentages. The exposure is that they cite them as safety scores, suppression-progress percentages, or causation conclusions without first asking what the number was generated to prove.
This analysis is informational and does not provide legal advice.
References
- Wildfire Containment Explained, RedZone, June 6, 2024.
- What Does Wildfire Containment Mean & How is it Measured?, WFCA.
- Understanding Wildfire Containment, West Buncombe Fire Department.
- What Does Containment Mean for a Wildfire?, Danko Meredith.
- Wildfire Data Is Flawed — Here's How to Fix It, The Revelator.
Comments
Join the discussion with an anonymous comment.