
What Do the Knoxville TLC Crime Study Numbers Mean?
A source-level verification of Knoxville's Project TLC evaluation, tracing each headline figure — the East District homicide decline, the citywide murder-rate drop, and the Montgomery Village projection — to its denominator and baseline. You'll know which numbers are confirmed, which are reported, and what caveats you must attach before citing them.
- Jurisdiction
- Tennessee, US
- Court
- Not a court proceeding
- AI tool named
- No AI tool named
- Ruling date
- Jul 29, 2026
- Source document
- View primary court order ↗
- Last verified
- Aug 4, 2026
Lex Machina Review is an independent risk-tracking and reference resource. Nothing on this site is legal advice, and using it does not create an attorney-client relationship. Every record is reviewed against primary sources but may not reflect the most current status of a matter — always verify directly against the cited court order, rule text, or a licensed attorney before relying on it.
Companion explanation — secondary to the source document above
The short verification answer
For anyone trying to cite the Knoxville TLC crime reduction study in a criminal justice memo, news story, grant file, or brief, the safe answer is narrower than the headline language. The UT SWORPS final evaluation supports a downward direction in violence and reports a particularly important projection-based result in Montgomery Village, but the familiar figures do not measure the same thing and should not be collapsed into one claim about Project TLC.
The load-bearing source is the UT SWORPS final evaluation report released on July 29, 2026, reviewed here as the primary source for the evaluation’s own findings.[1] Around it sit three different headline numbers: KPD’s East District murder count fell from 24 in 2022 to 8 in 2024, a 67% decline, in the department’s preliminary 2024 Priority Crime Report; local coverage quoting the evaluation describes Knoxville’s citywide murder rate moving from about 17 per 100,000 in 2022 to about 7 per 100,000 in 2025; and the evaluation reports violent crime in Montgomery Village at about 60% below a trend-based projection using Holston Oaks as the comparison neighborhood.[2][3][4][1]
Those are all useful facts. They are not interchangeable facts. One is a police district count, one is a citywide rate, and one is a neighborhood-level counterfactual estimate. Treating them as one general “TLC cut crime by X%” statistic makes the evidence sound cleaner than it is.

| Figure | What it measures | Safer citation form | Main caveat |
|---|---|---|---|
| 67% homicide decline | East District murders: 24 in 2022 and 8 in 2024 | KPD preliminary East District homicide data, not a generic TLC-zone result | KPD says its priority crime data is preliminary until TBI-audited.[2] |
| Citywide murder-rate drop | Knoxville murder rate: about 17 per 100,000 in 2022 to about 7 per 100,000 in 2025 | A citywide rate reported from the evaluation in local coverage | It does not isolate the effect of TLC zones.[3][4] |
| About 60% lower violent crime | Montgomery Village violent crime compared with a trend-based projection from Holston Oaks | A projection-based comparison for Montgomery Village | It is the strongest causal-looking claim, but it still carries the report’s attribution limits.[1] |
What the 67% number can and cannot carry
The 67% homicide figure is the easiest number to remember and the easiest one to mishandle. In KPD’s 2024 Priority Crime Report, the East District had 24 murders in 2022 and 8 in 2024. That arithmetic produces the 67% decline. KPD’s release also says the figures are preliminary and subject to Tennessee Bureau of Investigation audit, which is not a decorative footnote when the claim is going into a legal or policy document.[2]
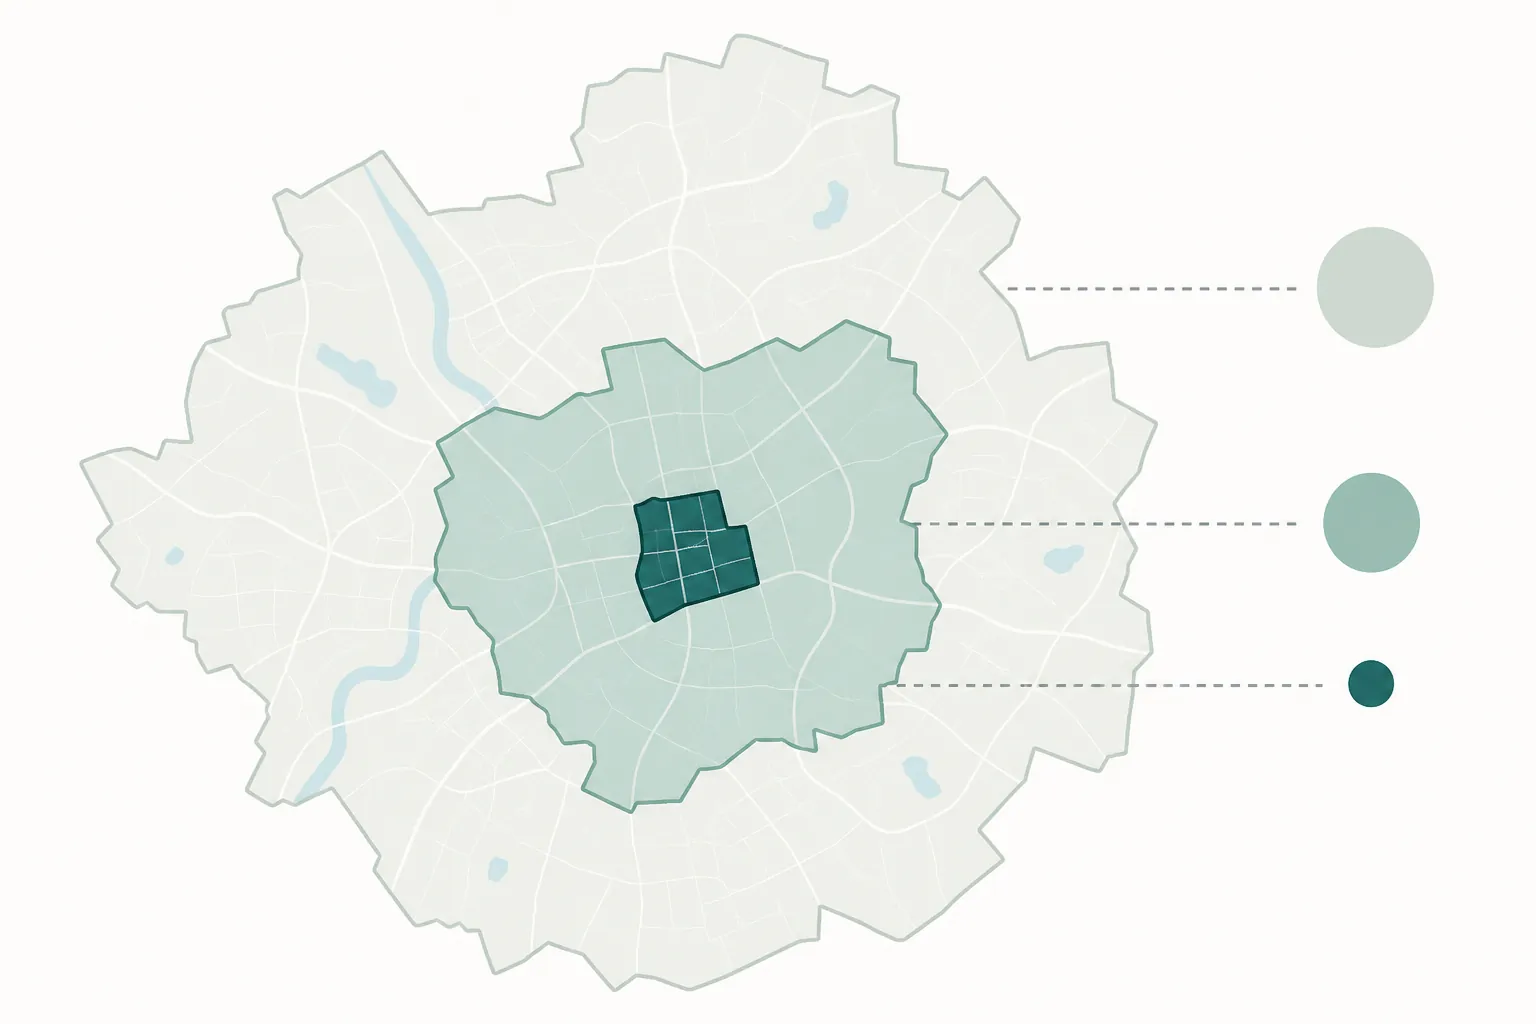
The East District is not the same thing as the East TLC zone. That distinction matters because Project TLC’s public materials also describe a much smaller East TLC zone, a 7.5-block area, with zero murders in 2024 and an approximately 17-month stretch without a fatal or non-fatal shooting.[7][6] That is a concrete public-safety claim, and it may reflect something residents felt directly. It is also a small-zone claim resting on very small counts, so it should not be asked to do the work of a districtwide or citywide analysis.
The clean way to cite the 67% number is therefore plain: “KPD reported that murders in Knoxville’s East District fell from 24 in 2022 to 8 in 2024, a 67% decline, in preliminary data subject to TBI audit.” If the sentence instead says “Project TLC zones saw a 67% homicide reduction,” the geography has changed and the source trail is no longer clean unless the evaluation itself is being quoted for that exact zone-level formulation.
The citywide rate is broader, not stronger
The citywide murder-rate figure is a different kind of measurement. WVLT and WIVK, quoting the evaluation, reported that Knoxville’s murder rate fell from about 17 per 100,000 people in 2022 to about 7 per 100,000 in 2025.[3][4] A rate is useful because it accounts for population size. It is also citywide, which means it includes places inside and outside TLC communities.
That broader scope makes the number good context for Knoxville’s overall violence trend, but it does not by itself answer whether TLC caused the decline. The evaluation itself, as described in coverage and reflected in the report’s cautionary framing, does not treat every citywide improvement as attributable to Project TLC.[1][5] That caveat should travel with any sentence that uses the rate to discuss the program.
KPD’s 2026 updates point in the same downward direction, but they should stay in the context lane. KPD reported zero murders in the first quarter of 2026, calling it the first zero-homicide quarter since 1988, and reported non-fatal shootings down 82% for that quarter.[8] Later in April, KPD said the city had recorded zero murders and two non-fatal shootings through April 27, 2026.[6] Those updates may help describe the broader environment around the evaluation. They do not prove the neighborhood-level effect of TLC.
Why Montgomery Village is the number worth slowing down for
The Montgomery Village finding is the most important single crime-number claim in the evaluation materials because it uses a comparison rather than a before-and-after count alone. The evaluation reports that violent crime in Montgomery Village was about 60% lower than projected based on trends in nearby Holston Oaks, the comparison neighborhood.[1]

That construction matters. A simple before-and-after count asks whether crime went down after an intervention began. A projection-based comparison asks a more demanding question: what would the neighborhood have been expected to experience if it followed a comparison trend, and how far did the actual outcome fall below that expectation? It is still not magic. The comparison depends on the suitability of Holston Oaks as a counterfactual and on the model choices used in the evaluation. But it is a more serious claim than pointing at a raw decline and calling the program responsible.
Local coverage also quotes the evaluation’s account of the Montgomery Village result, including the roughly 60% figure and the Holston Oaks comparison.[3][4][5] Those stories are useful as intermediaries, especially for public release context, but the defensible citation should still go back to the UT SWORPS report when the claim appears in formal writing.[1]
Two limits remain visible. The materials reviewed for this record do not provide a clear displacement test showing whether crime moved into adjacent areas, and they do not supply a reported statistical-significance result that would let a reader describe the estimate in those terms. That does not erase the Montgomery Village finding. It does mean the claim should be written as an evaluation estimate, not as a settled causal law.
Survey findings help explain community perception, not the denominator problem
The evaluation’s survey findings belong in the record, but after the crime-number sorting. Coverage of the report says residents in TLC communities reported higher trust in police and city leaders, more positive interactions with officers, and a greater likelihood of perceiving positive change in neighborhood safety compared with residents in comparison neighborhoods.[3][4][5]
Those findings matter because Project TLC is not described only as enforcement. UT’s College of Social Work describes SWORPS, the Social Work Office of Research and Public Service, as part of a formalized 2025 partnership with Knoxville’s Office of Community Safety and Empowerment, with the evaluation work directed through applied research and evaluation.[9] In that setting, trust, resident contact, and perceived safety are not side issues. They are part of what the intervention was trying to change.
They still do not rescue an imprecise crime statistic. A resident survey can support the report’s account that people in TLC areas experienced the work differently from residents in comparison neighborhoods. It cannot turn an East District homicide count into a TLC-zone homicide count, or a citywide murder rate into proof of neighborhood-level causation.
The reported survey themes are also useful for understanding what residents identified as drivers of violence. WVLT and WIVK reported that residents pointed to drug activity, anger and personal conflicts, limited employment opportunities, and housing challenges as root causes.[3][4] That is relevant context for a community-safety program. It is not a substitute for the denominator and baseline attached to each crime metric.
Source hierarchy for citation
The best citation path is not complicated, but it does require discipline. Use the UT SWORPS report for the evaluation’s own findings, especially the Montgomery Village projection and the report’s attribution caveats.[1] Use KPD releases for KPD counts, and carry KPD’s preliminary/TBI-audit warning when using those counts.[2] Use local news accounts when they are quoting or summarizing the report, but do not let coverage language become the only source for a formal claim if the PDF is available.
One source should not be used here: search-result snippets. Figures that appear only in inaccessible snippets, including additional non-fatal shooting and homicide estimates attributed to WBIR in search results, should not be cited unless the underlying article or the report text is directly verified. Snippets are leads for verification, not sources.
This article is a source-verification record, not legal advice and not ordinary AI-legal-practice coverage. Its purpose is narrower: to keep a public-safety evaluation from being weakened by overbroad repetition of its most attractive numbers.
Defensible wording
A defensible citation can say that the UT SWORPS evaluation supports evidence of violence reduction associated with Project TLC, including a notable Montgomery Village finding in which violent crime was about 60% lower than a trend-based projection using Holston Oaks as the comparison neighborhood.[1] It should also say, when discussing attribution, that the report does not assign all of Knoxville’s broader crime decline to TLC.[1][5]
A defensible citation can say that KPD reported East District murders fell from 24 in 2022 to 8 in 2024, a 67% decline, but it should identify the geography as East District and note that the KPD data was preliminary pending TBI audit.[2]
A defensible citation can say that local coverage quoting the evaluation reported Knoxville’s citywide murder rate moving from about 17 per 100,000 in 2022 to about 7 per 100,000 in 2025.[3][4] It should not present that rate as a TLC-zone effect.
The unsafe sentence is the neat one: “Project TLC cut crime by 67%” or “TLC reduced violent crime by 60%” without geography, baseline, method, and attribution caveat. The study is stronger when cited less broadly.
References
- UT SWORPS Final Evaluation Report (PDF) — UT SWORPS, July 29, 2026.
- KPD Releases Preliminary 2024 Priority Crime Report — Knoxville Police Department, January 2025.
- Knoxville crime program cuts violent offenses in target neighborhoods — WVLT, July 29, 2026.
- Project TLC Credited with Reducing Violent Crime and Strengthening Communities in Knoxville — WIVK, July 29, 2026.
- Project TLC UT SWORPS evaluation — WATE, July 29, 2026.
- Knoxville Police Department, Office of Community Safety Launch New Project TLC Zone in Lonsdale Community — Knoxville Police Department, April 28, 2026.
- City of Knoxville blog (East TLC zone results) — City of Knoxville.
- First Quarter Crime Data Shows Continued Drop in Violent Crime, Property Crime — Knoxville Police Department, April 2, 2026.
- Connection with City of Knoxville and SWORPS demonstrates link between community outreach and engaged research — University of Tennessee College of Social Work, September 10, 2025.
Related records
Tool profile
How Meta's AI Spending Reshapes Law Firm ProfitabilityGoverning regulation
Browse the obligations tracker →Preventive workflow
Browse verification workflows →
Report a correction or tip
Spotted an outdated figure, a misstated fact, or a ruling this case record should reflect? Public comments are disabled for this content given the professional cost of a misreported case outcome, penalty amount, or rule text — use the structured correction channel instead.
Report a correction or tip for this record →